Keeping your IT infrastructure running smoothly isn’t magic—it’s strategy. A solid system monitor is your first line of defense against downtime, bottlenecks, and security threats. Whether you’re managing a single server or a sprawling cloud network, real-time visibility is non-negotiable. Let’s dive into the world of system monitoring and uncover the tools, tactics, and best practices that keep systems humming.
What Is a System Monitor and Why It Matters

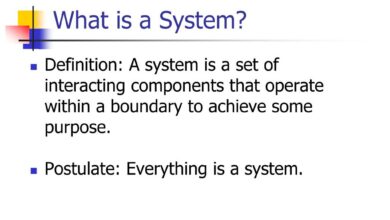
A system monitor is software designed to track the performance, availability, and health of computer systems, networks, and applications. It collects real-time data on CPU usage, memory, disk I/O, network traffic, and more, providing administrators with actionable insights. In today’s digital-first environment, where milliseconds matter and downtime costs thousands per minute, having a reliable system monitor isn’t optional—it’s essential.


Core Functions of a System Monitor
At its heart, a system monitor performs three critical functions: data collection, analysis, and alerting. It continuously gathers metrics from hardware and software components, processes that data to detect anomalies or trends, and triggers alerts when thresholds are breached. This proactive approach allows IT teams to resolve issues before they impact users.
- Real-time performance tracking
- Automated alerting and notifications
- Historical data logging for trend analysis
These functions enable organizations to maintain service level agreements (SLAs), optimize resource allocation, and improve overall system reliability. Without a system monitor, troubleshooting becomes reactive and guesswork-heavy—two things modern IT can’t afford.
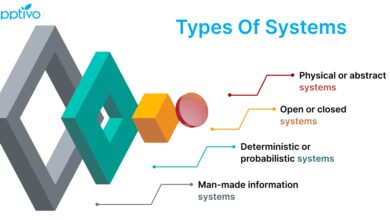
Types of System Monitoring
Not all monitoring is created equal. Depending on your infrastructure, you might need different types of system monitor approaches. The most common include:
- Server Monitoring: Tracks CPU, RAM, disk space, and uptime of physical or virtual servers.
- Network Monitoring: Observes bandwidth usage, latency, packet loss, and device status across network infrastructure.
- Application Performance Monitoring (APM): Focuses on software-level metrics like response time, error rates, and transaction traces.
- Cloud Monitoring: Extends monitoring to cloud environments like AWS, Azure, or Google Cloud, ensuring visibility across hybrid or multi-cloud setups.
Each type serves a unique purpose but often overlaps in practice. For example, slow application performance might stem from network latency or server overload—making integrated monitoring crucial. Tools like Zabbix and Nagios support multiple monitoring types within a single platform.
“Monitoring is not about collecting data—it’s about understanding what that data means for your business.” — DevOps Engineer, Fortune 500 Tech Firm
Top 7 System Monitor Tools in 2024
The market is flooded with monitoring solutions, but only a few deliver comprehensive features, scalability, and ease of use. Below are seven of the most powerful system monitor tools dominating the landscape in 2024.
1. Zabbix: Open-Source Powerhouse
Zabbix stands out as one of the most robust open-source system monitor platforms available. It supports distributed monitoring, auto-discovery, and web-based dashboards. With agent-based and agentless monitoring options, Zabbix can track everything from server load to website response times.
- Highly customizable alerting via email, SMS, or Slack
- Built-in visualization tools for graphs and maps
- Supports hundreds of metrics out of the box
Zabbix excels in large-scale environments due to its scalability and low cost of ownership. Its active community and extensive documentation make it a favorite among enterprise IT teams. Learn more at zabbix.com.
2. Nagios XI: The Veteran’s Choice
Nagios has been a cornerstone of system monitoring since 2002. Nagios XI, its enterprise-grade version, offers a polished interface, advanced reporting, and seamless integration with third-party plugins. While it has a steeper learning curve, its flexibility is unmatched.
- Extensive plugin ecosystem for custom monitoring
- Real-time problem detection and remediation workflows
- Supports both on-premise and cloud deployments
Nagios is ideal for organizations that require deep customization and control over their monitoring logic. Visit nagios.org to explore its capabilities.
3. Datadog: Cloud-Native Excellence
Datadog is built for modern, dynamic environments. As a SaaS-based system monitor, it integrates effortlessly with AWS, Kubernetes, Docker, and hundreds of other technologies. Its strength lies in real-time analytics, machine learning-driven anomaly detection, and collaborative dashboards.
- Automatic scaling for growing infrastructures
- AI-powered insights reduce false positives
- Strong DevOps and SRE alignment
Datadog’s pricing model is usage-based, which can be costly for large deployments, but the ROI in reduced downtime often justifies the expense. Explore Datadog at datadoghq.com.
4. Prometheus: The Kubernetes Native
Prometheus is an open-source monitoring and alerting toolkit originally developed at SoundCloud. Now a CNCF (Cloud Native Computing Foundation) project, it’s the go-to system monitor for Kubernetes and microservices architectures.
- Pull-based model with time-series database
- Powerful query language (PromQL)
- Tight integration with Grafana for visualization
Prometheus shines in containerized environments where ephemeral services require fast, reliable monitoring. While it lacks built-in high availability, clustering solutions like Thanos extend its capabilities. Get started at prometheus.io.
5. SolarWinds Server & Application Monitor (SAM)
SolarWinds SAM is a comprehensive solution for monitoring both physical and virtual servers, as well as business-critical applications. It offers deep application stack visibility, from database performance to user experience metrics.
- Pre-built templates for common applications (e.g., SQL Server, Exchange)
- Automated root cause analysis
- User-friendly interface with drag-and-drop dashboards
SAM is particularly popular in mid-sized enterprises due to its balance of power and usability. However, past security concerns have made some organizations cautious. Still, its monitoring depth remains impressive. Learn more at solarwinds.com/server-application-monitor.
6. PRTG Network Monitor: All-in-One Simplicity
Paessler’s PRTG is a Windows-based system monitor that combines server, network, and application monitoring in a single platform. It uses sensors to track various metrics, with over 200 types available out of the box.
- Auto-discovery of network devices
- Real-time bandwidth monitoring
- Free version available for up to 100 sensors
PRTG is praised for its intuitive interface and rapid deployment. It’s ideal for small to medium businesses looking for an easy-to-use yet powerful monitoring solution. Visit paessler.com/prtg for a free trial.
7. New Relic: Full-Stack Observability
New Relic offers a full-stack observability platform that goes beyond traditional system monitor functions. It combines metrics, logs, traces, and user sessions into a unified view, enabling teams to understand not just *if* a system is down, but *why*.
- Real user monitoring (RUM) for frontend performance
- Distributed tracing for microservices
- AI-driven alerting and incident management
New Relic’s strength lies in its ability to connect infrastructure performance with business outcomes. While pricing can be steep, its insights are invaluable for digital-native companies. Explore it at newrelic.com.
Key Metrics Tracked by a System Monitor
A good system monitor doesn’t just collect data—it collects the *right* data. Understanding which metrics matter most can help you set meaningful thresholds and avoid alert fatigue.
CPU Usage and Load Average
CPU usage indicates how much processing power is being consumed. Consistently high CPU usage (above 80%) can signal performance bottleneekes, inefficient code, or insufficient resources. Load average, especially on Unix-like systems, shows the number of processes waiting for CPU time over 1, 5, and 15-minute intervals.
- Sustained high load may indicate memory leaks or runaway processes
- Correlate CPU spikes with application logs to identify root causes
- Use baselines to distinguish normal peaks from abnormal behavior
Tools like top, htop, and system monitor dashboards make it easy to visualize CPU trends over time.
Memory Utilization and Swap Usage
Memory (RAM) is critical for system performance. When available memory runs low, the OS starts using swap space on disk, which is significantly slower. A system monitor should track both physical memory usage and swap activity.
- Monitor for memory leaks in long-running applications
- Watch for frequent swapping, which degrades performance
- Set alerts for when free memory drops below 10-15%
Modern tools like Datadog and New Relic provide memory breakdowns by process, helping pinpoint resource hogs.
Disk I/O and Storage Capacity
Disk performance directly impacts application responsiveness. High disk I/O wait times can cause system lag, while low free space risks crashes. A system monitor should track:
- Read/write operations per second (IOPS)
- Disk queue length
- Available storage space (with alerts for thresholds like 85% full)
For databases and file servers, monitoring disk latency is crucial. Tools like Zabbix and PRTG offer detailed disk health reports, including SMART data for physical drives.
“If your disk is the bottleneck, no amount of CPU or RAM will fix it.” — Senior Systems Architect
How to Choose the Right System Monitor for Your Needs
Selecting a system monitor isn’t a one-size-fits-all decision. The right tool depends on your infrastructure size, technical expertise, budget, and long-term goals.
Assess Your Infrastructure Complexity
Start by mapping your environment. Are you running physical servers, virtual machines, containers, or a mix? Do you use cloud platforms? A small business with a few servers might thrive with PRTG or Nagios Core, while a cloud-native startup may need Prometheus or Datadog.
- On-premise only? Consider Zabbix or SolarWinds
- Hybrid or multi-cloud? Look at Datadog or New Relic
- Kubernetes-heavy? Prometheus is a must
Understanding your stack helps narrow down compatible tools.
Evaluate Scalability and Performance
Will your system monitor handle growth? Some tools struggle with high-frequency data collection across thousands of nodes. Check for:
- Maximum number of monitored devices or metrics per second
- Database performance under load
- Support for distributed or clustered architectures
For example, Zabbix can scale to tens of thousands of devices with proper tuning, while open-source Prometheus requires external solutions like Thanos or Cortex for horizontal scaling.
Consider Ease of Use and Learning Curve
A powerful tool is useless if your team can’t use it. Evaluate the user interface, documentation, and training resources.
- Does it offer pre-built dashboards and templates?
- Is there a mobile app or Slack integration?
- How long does onboarding take?
PRTG and Datadog are known for user-friendly designs, while Nagios and Prometheus require more technical expertise but offer greater flexibility.
Setting Up Alerts and Notifications
One of the most valuable features of any system monitor is its alerting engine. Properly configured alerts ensure you’re notified of issues before they escalate.
Defining Thresholds and Baselines
Alerts should be based on meaningful thresholds, not arbitrary numbers. Start by establishing baselines—normal performance levels during typical usage.
- Use historical data to determine average CPU, memory, and disk usage
- Set dynamic thresholds that adapt to time-of-day or workload changes
- Avoid setting alerts too low (causing noise) or too high (missing real issues)
For example, a web server might normally use 40% CPU during the day but spike to 70% during traffic surges. An alert at 60% might be too aggressive unless sustained.
Notification Channels and Escalation Policies
A system monitor should support multiple notification methods: email, SMS, push notifications, and integrations with collaboration tools like Slack, Microsoft Teams, or PagerDuty.
- Route critical alerts to on-call engineers via SMS or phone calls
- Send informational alerts to team channels
- Implement escalation policies if alerts aren’t acknowledged
Tools like Nagios and Datadog allow complex notification routing based on severity, time, and team availability.
Reducing Alert Fatigue
Too many alerts lead to desensitization—where real issues get ignored. To combat alert fatigue:
- Consolidate related alerts into a single incident
- Use deduplication and suppression rules
- Leverage AI to distinguish between anomalies and normal fluctuations
Datadog’s Machine Learning models, for instance, can detect unusual patterns without manual threshold setting, reducing false positives by up to 60%.
Integrating System Monitor with DevOps and SRE Practices
Modern IT operations are no longer siloed. A system monitor is now a core component of DevOps and Site Reliability Engineering (SRE) workflows.
Monitoring in CI/CD Pipelines
Integrating monitoring into Continuous Integration/Continuous Deployment (CI/CD) pipelines ensures that performance is tested before code reaches production.
- Run synthetic transactions during deployment to verify service health
- Compare pre- and post-deployment metrics to detect regressions
- Automatically roll back if key metrics degrade
Tools like New Relic and Datadog offer APIs that integrate directly with Jenkins, GitLab CI, and GitHub Actions.
Incident Management and Post-Mortems
When outages occur, a system monitor provides the data needed for effective incident response and post-mortem analysis.
- Timeline reconstruction using metric logs
- Correlation of alerts with deployment events
- Root cause identification through data triangulation
Platforms like PagerDuty and Opsgenie integrate with system monitor tools to automate incident tracking and resolution workflows.
SRE and Service Level Objectives (SLOs)
Site Reliability Engineers use system monitor data to define and track Service Level Objectives (SLOs), such as uptime, latency, and error budgets.
- Calculate error budgets based on allowable downtime
- Use dashboards to visualize SLO compliance in real time
- Trigger alerts when error budgets are consumed too quickly
Google’s SRE practices emphasize using monitoring data to make data-driven decisions about feature releases and infrastructure changes.
Future Trends in System Monitoring
The field of system monitoring is evolving rapidly, driven by advances in AI, cloud computing, and distributed systems.
AIOps and Predictive Monitoring
Artificial Intelligence for IT Operations (AIOps) is transforming how system monitor tools analyze data. Instead of just reacting to thresholds, AIOps platforms predict issues before they occur.
- Analyze historical patterns to forecast resource exhaustion
- Automatically correlate events across systems
- Reduce mean time to resolution (MTTR) through intelligent recommendations
Companies like Moogsoft and BigPanda are leading the AIOps space, integrating with existing system monitor tools to enhance their intelligence.
Observability vs. Monitoring
While traditional monitoring focuses on predefined metrics, observability emphasizes understanding system behavior through logs, metrics, and traces. The shift reflects the complexity of modern architectures.
- Observability allows debugging unknown-unknowns
- Requires richer data collection and correlation
- Tools like OpenTelemetry are standardizing data formats
The future lies in unified observability platforms that combine monitoring with deep diagnostics, moving beyond “is it up?” to “why did it behave that way?”
Edge and IoT Monitoring
As computing moves to the edge—smart devices, sensors, and remote locations—monitoring must follow. Edge environments pose unique challenges: limited bandwidth, intermittent connectivity, and diverse hardware.
- Lightweight agents that consume minimal resources
- Store-and-forward mechanisms for offline data
- Centralized dashboards for distributed devices
System monitor tools are adapting with edge-specific agents and gateways, ensuring visibility even in the most remote deployments.
What is a system monitor used for?
A system monitor is used to track the performance, availability, and health of IT systems. It helps detect issues like high CPU usage, low memory, disk failures, or network outages, enabling proactive maintenance and minimizing downtime.
Which system monitor tool is best for beginners?
PRTG Network Monitor and Datadog are excellent choices for beginners due to their intuitive interfaces, auto-discovery features, and comprehensive documentation. Both offer free tiers to get started without risk.
Can I use a system monitor for cloud environments?
Yes, many system monitor tools like Datadog, New Relic, and Prometheus are designed specifically for cloud and hybrid environments. They integrate with AWS, Azure, GCP, and Kubernetes to provide full visibility across distributed systems.
Is open-source system monitor software reliable?
Absolutely. Open-source tools like Zabbix, Nagios, and Prometheus are widely used in enterprise environments. They offer transparency, customization, and strong community support, making them both reliable and cost-effective.
How do I reduce false alerts from my system monitor?
To reduce false alerts, set intelligent thresholds based on historical baselines, use anomaly detection with machine learning, consolidate related alerts, and implement alert suppression during maintenance windows. Tools like Datadog and New Relic offer built-in features to minimize noise.
In today’s fast-paced digital landscape, a robust system monitor is no longer a luxury—it’s a necessity. From preventing costly outages to optimizing performance and supporting DevOps workflows, the right monitoring strategy empowers organizations to stay ahead of problems before they impact users. Whether you choose an open-source powerhouse like Zabbix or a cloud-native platform like Datadog, the key is consistency, clarity, and continuous improvement. As technology evolves, so too must our approach to monitoring, embracing AI, observability, and edge computing to build resilient, future-proof systems.
Further Reading: